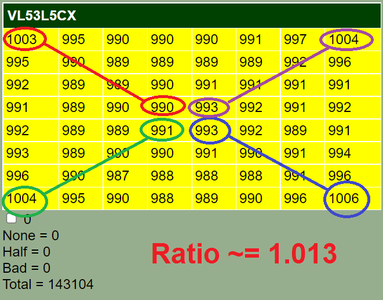
Why ? That ratio is not constant.
In the general case where the sensor can be at some oblique angle, you are right... the ratio is not constant. In your description, you have selected to have the edge perpendicular to the wall and the center pointing 22.5 relative to that. However, from a testing perspective there is no way to confirm that you are precisely 22.5 degrees off. I understand your procedure and I confirmed all you math (just to double check that I understood you fully). Angles are the least accurate things to measure. There is no protractor (that I can afford) accurate enough. There is no sensor that tells me angle accurately enough. The only way I know of is to center it until the corner readings from the sensor are all equal. THEN, I KNOW that the center is perpendicular.
The "centre would be closest" would only be true if you were taking measurements from a position mostly perpendicular to the wall.
In this contrived test configuration that I have been using, the sensor is pointing perpendicular to the wall. This can be confirmed by the ~distances of the four corners. If they were exactly the same as each other, the sensor would be exactly perpendicular to the wall.
If you now move the scanner so that the centre is pointing at 45 degrees to the right, the left distance is now 10.8 feet (22.5 degrees)
At no time do I move the sensor. In all those tests, the sensor did not get moved.
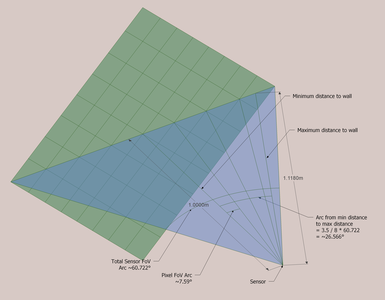
Now... the closest point is near the center of the 8x8 grid. At 3.5 times the pixel FoV angle over from the center, will be the distance to the center of the furthest pixel (the corner ones). The ratio is fixed for this configuration. It doesn't matter if the sensor is 2" from the wall or 4 meters. The ratio is constant by...
- The FoV angle is constant - The data sheet tells me so.
- By definition: cos(ϴ) = adjacent side / hypotenuse
- The adjacent side is the minimum distance to the center of the sensor FoV.
- The hypotenuse is the distance to the center of the corner pixel FoV.
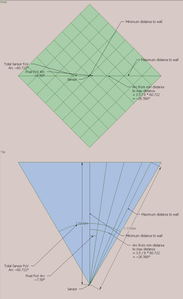
I have re-oriented the sketch so all the angles are on the diagonal of the 8x8 grid and also shown all four quadrants. Hopefully, this helps to explain.
So my contention is theory suggest that the ratio (for this configuration) should be 1.1180.
However given one of the examples from above, the ratio is only around 1.0130.
Now, if you think I'm still wrong, keep trying. I'm pretty dense, but a baseball bat usually works... eventually.
VBR,
Inq
3 lines of code = InqPortal = Complete IoT, App, Web Server w/ GUI Admin Client, WiFi Manager, Drag & Drop File Manager, OTA, Performance Metrics, Web Socket Comms, Easy App API, All running on ESP8266...
Even usable on ESP-01S - Quickest Start Guide
For the following, assume that you're positioned 10 feet directly in front of the wall and you're scanner is pointing 22.5 degrees to the right of that. Assume that everything is done in the horizontal plane so that we have only 1 dimension to consider ...
Thought about it some more. I guess if I rotate it back and forth until the edge in question reaches a minimum, that would be perpendicular and, I could call that the starting point of the test.
- The advantage your method would have is to utilize the full sensor width versus half as in my method. Gets higher resolution results. I'll have to try it when I get back out to the auditorium. But... as I mentioned earlier the oblique angle test results made sense and I suspect yours will also come out more closely to theoretical.
- The advantage my method would have is the results on the output show that it is centered and perpendicular and how accurately. Everything is on the screen to do the calculations and is verifiable.
VBR,
Inq
3 lines of code = InqPortal = Complete IoT, App, Web Server w/ GUI Admin Client, WiFi Manager, Drag & Drop File Manager, OTA, Performance Metrics, Web Socket Comms, Easy App API, All running on ESP8266...
Even usable on ESP-01S - Quickest Start Guide
The lidar may be looking under a couch and seeing the back wall and knock its head off as it proceeds.
No it detects the couch with its bumper sensor 🙂 I have yet to try an accelerometer sensor to detect bumps.
I found some interesting data from google with the search phrase "difference between lidar and TOF"
The TOF sensors seem to require some complex algorithms to get the best results.
With your video the robot vanishes off screen at the end. Maybe it would look better with a landscape view or the video being taken a bit further back from the start?
I notice the wheels wobble? I don't have a 3d printer so I can't make those things myself.
I'm not sure I'm understanding your diagram. I thought each rectangle represented the theoretical area covered by a single "pixel" but the rectangles are not square. Are they not created by the 7.59 degree square angles projected from the sensor ?
Anything seems possible when you don't know what you're talking about.
No it detects the couch with its bumper sensor
I have yet to try an accelerometer sensor to detect bumps.
That would certainly work! They're touchy little $#!+$! In fact you could do the X/Y trig and know exactly which side hit. All with one little digital sensor and no complicated, mechanical bumpers. That's a great idea... I'll have to bookmark that for future projects.
The TOF sensors seem to require some complex algorithms to get the best results.
There is some convoluted boot up procedure where the SparkFun library actually uploads code to the sensor... it takes about 2.5 seconds. Although haven't looked into it, I think that also contains the gesture recognition stuff.
I notice the wheels wobble? I don't have a 3d printer so I can't make those things myself.
Yeah! I was hoping no one would notice. Thanks for that! 🙄 😉
I think it's a combination of the heat softens the plastic and the screws pressing pushes it off center. For the 3rd I'll being trying some other materials. I have some Nylon and some Carbon Fiber fill Polycarbonate. One of those should solve that problem. I may try to put symmetric bolts also. None the less, the calibration was able to account for that... at least over a full revolution. I imagine fractional revs might be out of spec.
VBR,
Inq
3 lines of code = InqPortal = Complete IoT, App, Web Server w/ GUI Admin Client, WiFi Manager, Drag & Drop File Manager, OTA, Performance Metrics, Web Socket Comms, Easy App API, All running on ESP8266...
Even usable on ESP-01S - Quickest Start Guide
I'm not sure I'm understanding your diagram. I thought each rectangle represented the theoretical area covered by a single "pixel" but the rectangles are not square. Are they not created by the 7.59 degree square angles projected from the sensor ?
Are you saying they're not square, because it's an orthogonal view or because in the real thing, they're not square?
Orthogonal Help
Sorry, I should know better. Sometimes I look at the drawing and is it a horse or a goat, is it pointing away or right at me. That's an orthogonal view. Because I'm rotating it in the CAD program, it just makes sense to me, but no-one else has that luxury.
Here's the front and top views. I did rotate the 8x8 45 degrees just so I could show the diagonal FoV in the XY plane. The maximum difference is from center to corner, not center to edge.
Yes, each rectangle in the green, front-view (as if you're looking through the sensor). The blue shows (1) the diagonal FoV of the sensor, (2) of a pixel FoV and (3) of the arc from min to max = 3.5 * pixel FoV.
Does this help?
Not Square Help
According to the datasheet the pixel angle is constant, so the outer pixels would see more of the wall area because of the Trig. The ones on the diagonal will be square, but all the others will be rectangular.
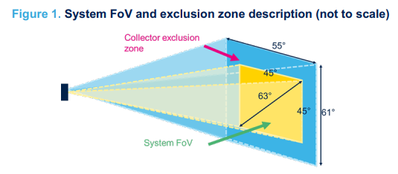
Now... all that said, When you originally questioned my Math, I re-looked at the datasheet. And it clearly says the horz/vert are 45 degrees and the diagonal FoV is 63 degrees.
Unfortunately, they let some Intern write that as 63 = sqrt(45^2 + 45^2). And you can't use Pythagorean theorem on angles. The actual diagonal FoV is 60.7 degrees if we assume the 45 degrees are valid numbers. Which means... We need to question which are the facts and which are the dependencies. Are the angles constant and have rectangle areas or are they really squares and the angles vary? All this is down in the noise level... and would only introduce something in single digits type error.
Theory calculating 1118 mm and only getting 1010 is way more error!
VBR,
Inq
3 lines of code = InqPortal = Complete IoT, App, Web Server w/ GUI Admin Client, WiFi Manager, Drag & Drop File Manager, OTA, Performance Metrics, Web Socket Comms, Easy App API, All running on ESP8266...
Even usable on ESP-01S - Quickest Start Guide
Thanks for the ?clarification? 🙂 I confess that that did help and I'm somewhat less confused now than before.
I admire your tenacity at sticking with this sensor, I'd have given it cement overshoes and a swimming lesson in the river long ago.
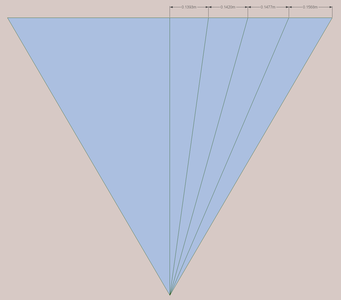
I think I'll try to work on the last illustration (titled Figure 1) to see what I can find. I think I understand it 🙂
Anything seems possible when you don't know what you're talking about.
I admire your tenacity at sticking with this sensor, I'd have given it cement overshoes and a swimming lesson in the river long ago.
I'm not sure if it's pig-headedness or that I just have an image of simplicity that simply won't go away.
3 lines of code = InqPortal = Complete IoT, App, Web Server w/ GUI Admin Client, WiFi Manager, Drag & Drop File Manager, OTA, Performance Metrics, Web Socket Comms, Easy App API, All running on ESP8266...
Even usable on ESP-01S - Quickest Start Guide
Hi @inq,
I trust your wine bill isn't becoming excessive ... and you are not endangering your liver, etc. ... I do not want to be responsible for the consequences.... because you might need another glass now ... 😋
---------
I remember reading that each pixel detector is described as a SPAD Single Photon Avalanche Detector ... unfortunately I don't know too much about it, but I am imagining it is a solid-state analogue of a photo-multiplier-tube (PMT), albeit based on a different internal mechanism.
------------
With a PMT, a photon hitting the photocathode creates a mobile electron in the surrounding vacuum. This electron finds itself in an electric field and is accelerated (and gaining energy) towards the first anode. Collision with the first anode results in multiple electrons being freed. They experience a second electrical field between the first anode and the second anode, which similarly accelerates them into the second anode, each incoming electron resulting in several new electrons ... and so on through maybe 10 or more anodes, finally culminating in substantial electrical pulse at the last anode. (A common trick was to put the cathode at -1 kV or so, with the voltage reducing by say (-)100 V per anode, and hence the last anode was connected via a resistor to ground, so that the pulse could easily be fed to an amplifier. )
This electrical pulse can then be fed to a counter to record the detection of the photon.
By measuring the timing of this pulse, relative to a 'trigger' event that caused the photon to be produced, it is possible to measure the difference in timing between the original 'photon' producing event and the time of its subsequent detection.
I should say, that for the PMTs I came across some decades ago, this pulse timing was of the order of microseconds, but maybe the principle is still a helpful model for imagination purposes.
Note, it is taking things to the 'quantum' level, in that each recorded event is based on a single photon. Of course it is often necessary to count a considerable number of photons to get a useful overall result.
--------------
Avalanche Diodes are exceedingly common, albeit many are never 'used'! The MOSFET structure results in an intrinsic avalanche diode between the drain and the source. In 'normal' MOSFET operation, this diode is reverse biased and the applied voltage across drain to source is kept comfortably below the 'avalanche' voltage, so that (at least for simple considerations) its presence can be ignored.
However, if the reverse voltage across drain to source is steadily increased, exceeding the 'normal' operating conditions, then it will reach a point at which it suddenly conducts very strongly. This switching action is very fast.
Some circuits, particularly those switching current passing through an inductor, make use of this avalanche process to limit the voltage produced by the inductor when the current flow through the FET is switched off. Hence, data sheets for MOSFETs usually include a section describing the properties of the avalanche diode.
------------
SPECULATION TIME ...
As I say, I haven't found much detailed information about SPADs, but I am imagining that it is an Avalanche diode with a voltage across it which is just below the avalanche point ... then an incoming photon creates a 'free' photelectron, that is sufficient to 'trigger' the avalanche process, resulting in a sizeable current pulse that can be recorded.
The clever bit, which I have yet to track down, is the precise mechanism that is used determine the timing between the original trigger pulse of the laser and this resulting SPAD pulse. I can imagine a possibility or two, but I haven't seen a specific description from ST etc.
However, if my 'model' is close to reality, then I think it implies that if a single laser pulse results in two or more photons arriving at the detector at slightly different times, and each produces a photelectron, as the result of one laser pulse, only the first one can create an avalanche and hence be recorded. That is, following an avalanche, there will be a period of time whilst the internal capacitance of the device is being 'recharged' and it is incapable of supporting an avalanche.
-----------
Please remember, chunks of the above discussion are speculation, NOT KNOWLEDGE AND UNDERSTANDING ... they are just the best I can offer until further information comes my way.
----------
If the above speculation is 'close' to accurate, then I think this might help to explain some of the difficulties. Unfortunately, it doesn't give much advice as to how to proceed, and clearly there are some 'tricks' and 'parameters' that may be control the behaviour.
--------
My concern is that the device was designed for a specific case in which the 'annoying' characteristics are not encountered or are 'acceptable'. Hence, my desire to get a better understanding as to how it works.
========
Best wishes my friend, Dave
Hi @inq,
re: None the less, the calibration was able to account for that... at least over a full revolution. I imagine fractional revs might be out of spec.
Mechanical stuff is definitely something everyone else does better than me, so this may be ignorance on my part, but doesn't this give you problems on your 180 degree turns at the end of the hall?
I can understand making subtle changes to the drive to the left and right wheels to correct for slight changes in diameter on a straight line, but if the wheels have an assymetry around their circumference, then during a 180 or similar turn, it seems like it will be a matter of chance which fractions of the wheel are involved with each part of the vehicle turn.
Hence, empirically looking for a 'constant' correction factor could be doomed?
In fairness, you are looking for an extremely accurate control in that turn, so I am amazed you get as close as you do!
😉Maybe it's Heisenberg's Uncertainity Principle you should worry about, rather than the infamous cat?😉
Best wishes, Dave
OK, let's address the 45 degree first and see about the 63 or 60.722 or whatever.
The diagram LOOKS like the target region is centred left to right and oriented vertically down from the point level with the sensor. I mean that the entire scanned area is below the sensor's eye level.
Then if the sensor is held 1 meter from the wall and if the field of view be 45 degrees to each side and 45 degrees down, then the area scanned is 2 meters across and 1 meter deep (which doesn't agree with your measurement sets, so the diagram is wrong)
So, instead let's assume that the scanned area is 45 degrees from side to side and also 45 degrees up and down. So the sensor is pointed directly at the wall, at right angles in all orientations of the wall.
So, then the upper right corner of the scanned area will be up 22.5 degrees and across 22.5 degrees. The distance on the wall will be the distance from the wall times the tangent of the angle between the sensor-to-wall line and the sensor to top middle and sensor to right middle points.
Since we're assuming above that the distance to the wall is exactly one meter, the vertical distance on the wall will be tan(22.5) meters and the horizontal distance on the wall will be the same. So with values are 0.414 meters.
Pythagoras tells us that the diagonal will be the square root of the squares of the sides so square root of 2*(41.4)^2 = 2*1713.96 = 3427.92 is 58.5 cm or 0.585 m.
The angle subtended from the centre of the scanned area to the upper right corner is 58.5 cm, so the tangent of the angle is .585/1 and the arcTangent of .585 is 30.327 degrees.
But, since we're talking about only the top right, we need to double that value for the entire scanned area since the bottom left corner is the same distance away as the top right. Therefore, the total angle subtended is 2*30.327 = 60.654 degrees.
You had already claimed 60.722 from other means, so that's .068 degrees different or less than .112 % error. Seems like the value 60.722 is solid.
Anything seems possible when you don't know what you're talking about.
Hi @inq,
😉Maybe it's Heisenberg's Uncertainity Principle you should worry about, rather than the infamous cat?😉
Best wishes, Dave
Yes, so you can either know where it is or where it's going but not both at the same time 🙂
Anything seems possible when you don't know what you're talking about.
Mechanical stuff is definitely something everyone else does better than me, so this may be ignorance on my part, but doesn't this give you problems on your 180 degree turns at the end of the hall?
I'll be dipped... you're absolutely right. I hadn't put 2 and 2 together! If it does full integer revs it should be pretty much dead on... at least better than the 0.033% error, I've observed already. But the wheel rotation isn't exactly constant. As the shaft is slightly off-center some angles move further than others. So depending what part of each wheel was part of the movement segment, I'd get different turn angles. That would also explain why the repeatability was so bad... one time, I'd get 359.5 degrees, the next 361.2, the next 359.9.
Hmmm! That's going to keep me up worse than your vacuum tube analogy. 😆 Just teasing - I'm still processing on that one!
Hence, empirically looking for a 'constant' correction factor could be doomed?
Agreed - only answer is active correction with the sensors OR experimenting with other materials to make a better mouse-trap.
Maybe it's Heisenberg's Uncertainity Principle
Oh... don't even get me started on that. I was outputting debug info during my stepper motor driver critical micro-second stepping algorithms. It'd be smooth as glass accelerating or constant speed, but the gear changes were like an old Turbo Hydramatic 400 with quick-shift kit... basically enough to loose teeth. I spent hours trying smooth the transition. I gave up trying to improve it, took out the debug output... Ran smooth as glass! Heisenberg is not my friend.
VBR,
Inq
3 lines of code = InqPortal = Complete IoT, App, Web Server w/ GUI Admin Client, WiFi Manager, Drag & Drop File Manager, OTA, Performance Metrics, Web Socket Comms, Easy App API, All running on ESP8266...
Even usable on ESP-01S - Quickest Start Guide
OK, let's address the 45 degree first and see about the 63 or 60.722 or whatever.
The diagram LOOKS like the target region is centred left to right and oriented vertically down from the point level with the sensor. I mean that the entire scanned area is below the sensor's eye level.
Then if the sensor is held 1 meter from the wall and if the field of view be 45 degrees to each side and 45 degrees down, then the area scanned is 2 meters across and 1 meter deep (which doesn't agree with your measurement sets, so the diagram is wrong)
So, instead let's assume that the scanned area is 45 degrees from side to side and also 45 degrees up and down. So the sensor is pointed directly at the wall, at right angles in all orientations of the wall.
So, then the upper right corner of the scanned area will be up 22.5 degrees and across 22.5 degrees. The distance on the wall will be the distance from the wall times the tangent of the angle between the sensor-to-wall line and the sensor to top middle and sensor to right middle points.
Since we're assuming above that the distance to the wall is exactly one meter, the vertical distance on the wall will be tan(22.5) meters and the horizontal distance on the wall will be the same. So with values are 0.414 meters.
Pythagoras tells us that the diagonal will be the square root of the squares of the sides so square root of 2*(41.4)^2 = 2*1713.96 = 3427.92 is 58.5 cm or 0.585 m.
The angle subtended from the centre of the scanned area to the upper right corner is 58.5 cm, so the tangent of the angle is .585/1 and the arcTangent of .585 is 30.327 degrees.
But, since we're talking about only the top right, we need to double that value for the entire scanned area since the bottom left corner is the same distance away as the top right. Therefore, the total angle subtended is 2*30.327 = 60.654 degrees.
You had already claimed 60.722 from other means, so that's .068 degrees different or less than .112 % error. Seems like the value 60.722 is solid.
I concur with this completely... In fact when I ran with your procedure and kept all the the answer in the Windows calculator (all 15 million digits worth - I don't know what's up with that... its far more digits than double precision) it came out with 60.722386809643427389716039012936. I think your difference is only you must have rounded something along the way. The 60.722 I got from measuring on the CAD drawing. Gives me pretty good confidence in that software that the lines were all that accurately placed and measured. 😎
VBR,
Inq
3 lines of code = InqPortal = Complete IoT, App, Web Server w/ GUI Admin Client, WiFi Manager, Drag & Drop File Manager, OTA, Performance Metrics, Web Socket Comms, Easy App API, All running on ESP8266...
Even usable on ESP-01S - Quickest Start Guide
I was doing the calculations using only 3 digits so it's reasonable to expect a deviation of about 1 in 1000 or 0.1 % which is dam near spot on.
Anything seems possible when you don't know what you're talking about.

